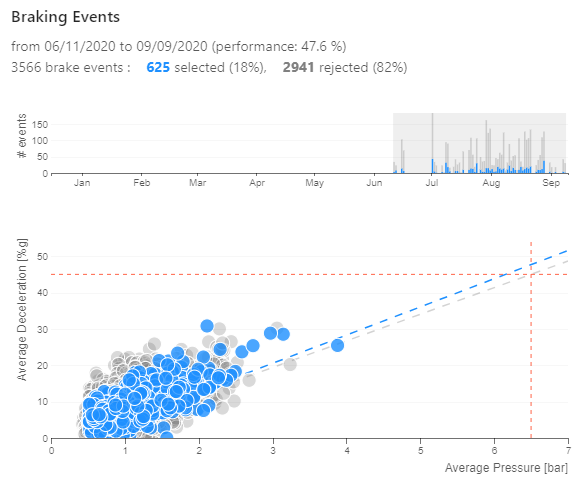
Overview of the performance history of the selected trailer and details on the (accepted/rejected) braking events.
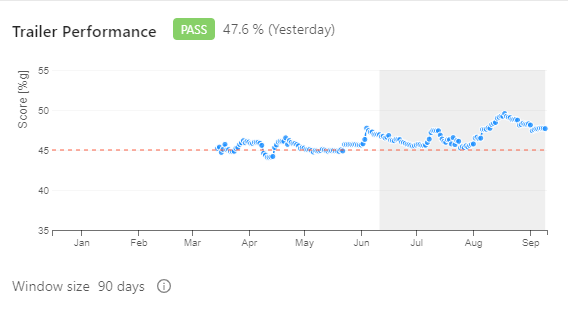
In order to achieve a ‘Pass’, the Braking Performance Value should be 45% or greater (at 6.5 bar).
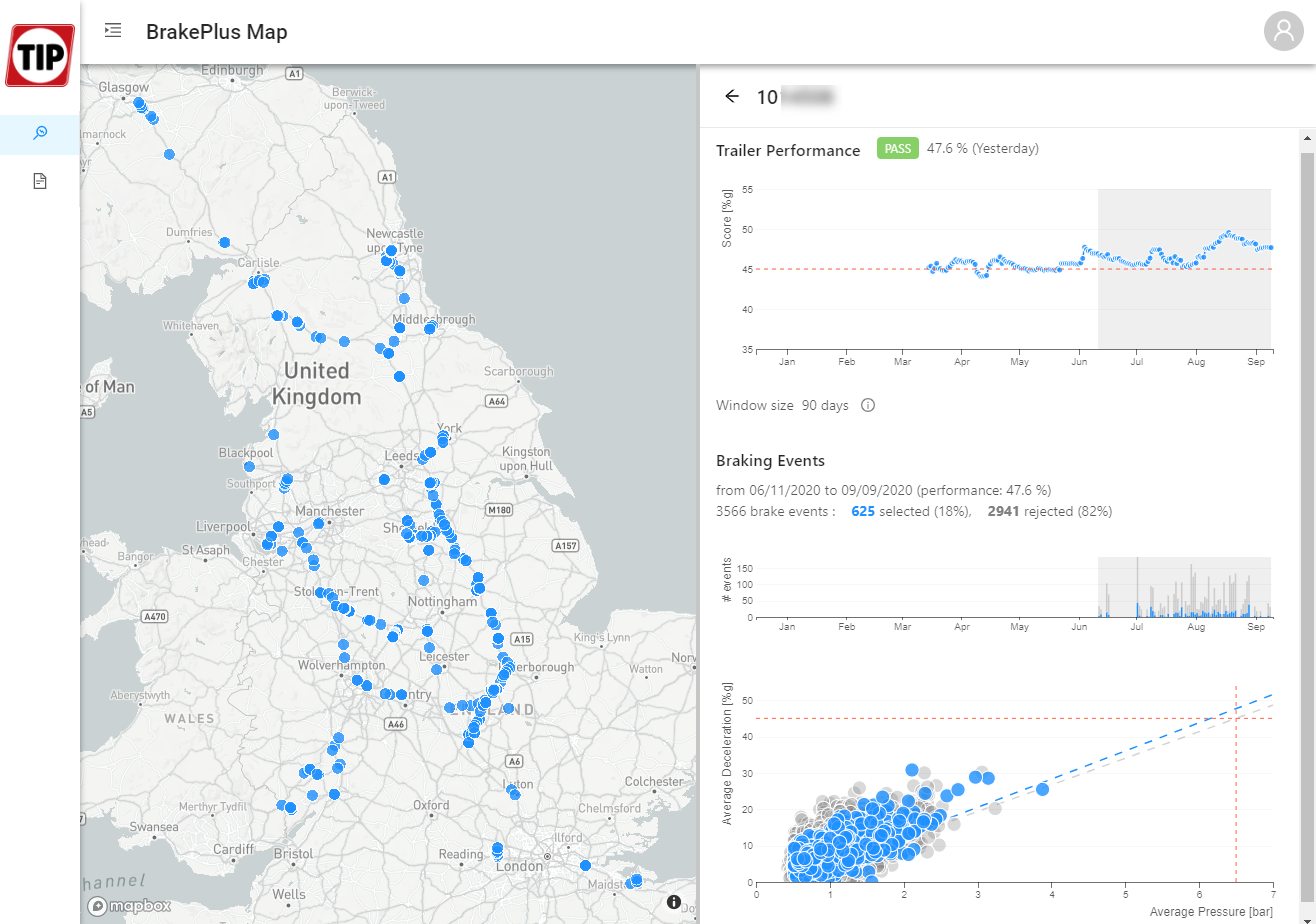
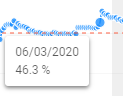
The Trailer Performance chart visualizes the BPV score for each day. The BPV score is calculated every day based on the registered braking events of the previous 90 days. This time frame can be adjusted in Settings (windows size: 45 or 90 days). A blue dot indicates a valid BPV score for every day in the selected time frame, both on the map and in the charts. If the BPV could not be calculated, because there were not enough valid brake events, the blue dot will be missing. You can click on a specific day on the chart to move the time frame to that day. By default, the latest available day is selected.
|
|
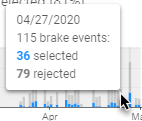
The Braking Events chart shows the details of all brake events used for the selected BPV score in the Trailer Performance chart above. You can click on a specific day on the chart to move the time frame in the Braking Events chart. Visualization of the performance of each brake event.
|
 |
Drag the slider across the timeline to visualize the brake event and the additional information (speed, pressure, height) on the map. The blue line indicates the speed. The red line visualizes the requested brake pressure. |
 |